MedSAM3 Instance Segmentation
PanNuke Patch and Lizard WSI are reported separately under different protocols
Results are reported separately by dataset and protocol. Values from different datasets are not combined into a single benchmark.
Standardize WSI and ROI data, connect pluggable models, run gigapixel inference, and evaluate results at slide level, with reproducible configurations from experiment to deployment.
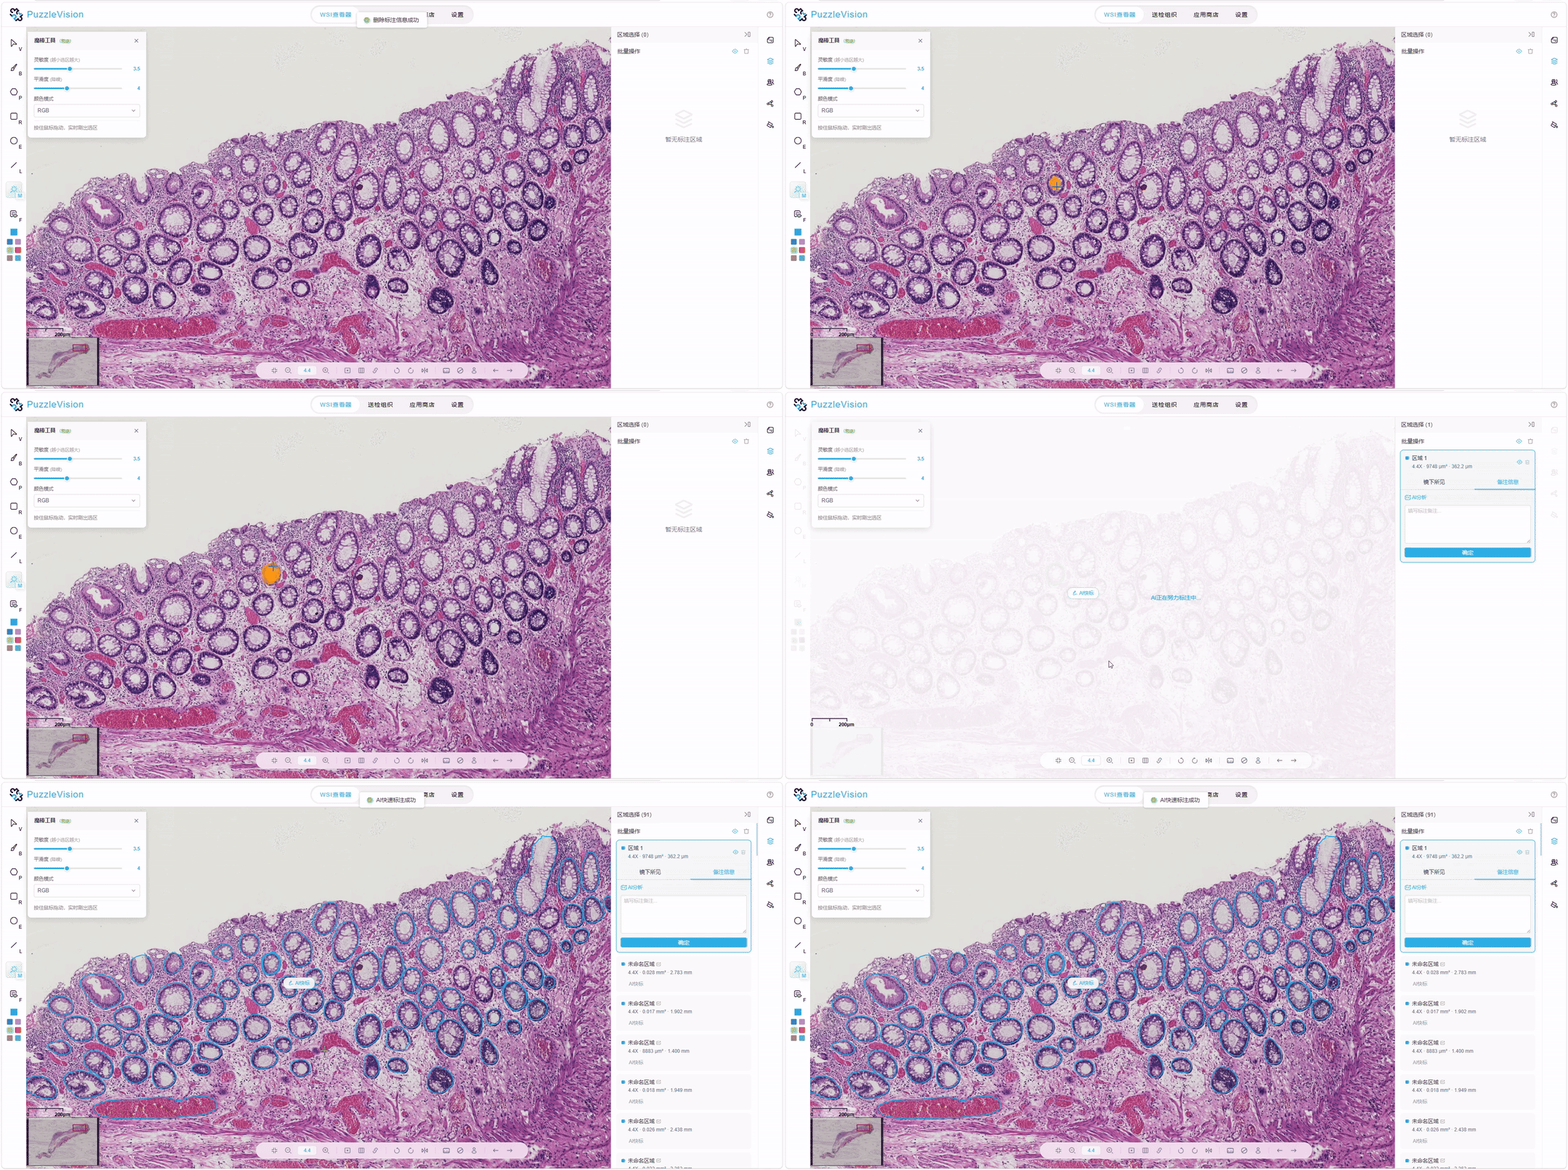
This demo shows a segmentation model trained and deployed with PuzzleSeg. PuzzleSeg is the underlying framework; the model and annotation interface are an example implementation.
Iterating between public datasets and in-house cohorts, and needing every experiment to stay reproducible and comparable.
Connecting multiple model families to one training and inference pipeline, then deploying WSI inference reliably in production.
Holding a model already validated on patches and needing to reach gigapixel slides without rewriting the engineering stack.
Every scanner, magnification, and annotation format gets its own reader, and one coordinate mistake distorts the whole pipeline.
A model that runs on patches hits memory, throughput, and tile-seam limits once it faces a gigapixel slide.
Patch-level metrics cannot answer slide-level questions, and configuration drift between runs is hard to trace.
Three shared interfaces for data, execution, and experiment provenance span training, gigapixel inference, slide-level evaluation, and reproduction.
Preserve consistent coordinate and scale semantics from ingestion to gigapixel inference.
Level-0 coordinates and MPP unify reading, tiling, and preprocessing.
Tissue filtering, window fusion, and sparse storage balance memory and throughput.
Connect models, training strategies, and distributed runtimes through stable interfaces.
SegmentationOutput and registries connect multiple model families by configuration.
Compose losses, AMP, DDP, FSDP, ZeRO-3, and PEFT / LoRA.
Unify metrics, configuration, and tracking so every experiment is reliable and auditable.
Aggregate patch predictions by slide while decoupling inference, metrics, and visualization.
Checkpoints retain configuration alongside experiment tracking and deterministic settings.
Control, execution, and artifact layers preserve WSI + ROI, Level-0 spatial semantics, and Patch-to-Slide traceability.
HYDRA YAML + CLI OVERRIDESConfiguration is centrally managed and retained with checkpoints · Reproducible · Composable · Traceable
DATA MANIFEST · CHECKPOINT + CONFIG · METRICS + OVERLAYS + REPORTS
Unified WSI + ROI · Level-0 spatial semantics · Patch-to-Slide traceability
Task type describes what a model outputs; input / prompt mode describes what drives the segmentation. They are independent dimensions, and integration status is tracked separately from task capability.
Task-specific training with a stable semantic segmentation baseline
IntegratedText or visual prompt segmentation with LoRA tuning and Patch / WSI evaluation
IntegratedGenerates masks from images and natural-language reasoning instructions with LoRA and ZeRO-3
IntegratedData schema and output interfaces support box annotations; a dedicated detection model is pending
PendingPanNuke Patch and Lizard WSI are reported separately under different protocols
Results are reported separately by dataset and protocol. Values from different datasets are not combined into a single benchmark.
Same 5 datasets · same single-tile record granularity
GlaS · same PuzzleSeg U-Net · Patch vs. Sliding-window aggregation
Magnified axis (.82—.95); Sliding-window closes more than half the gap to nnU-Net.
Triplet-V1 generates a structured pathology description. A resolver converts supported findings into concept prompts, and SAM3 grounds each prompt to image regions. This links selected report items to inspectable spatial masks.
A pathology multimodal model reads the slide scale by scale and writes a structured description.
Image→Structured findingsEach report item becomes a concept prompt that a segmentation model can consume.
Structured findings→Concept promptsTriplet-V1 and SAM3 reason jointly to produce one spatial mask per concept.
Concept prompts→Spatial masks
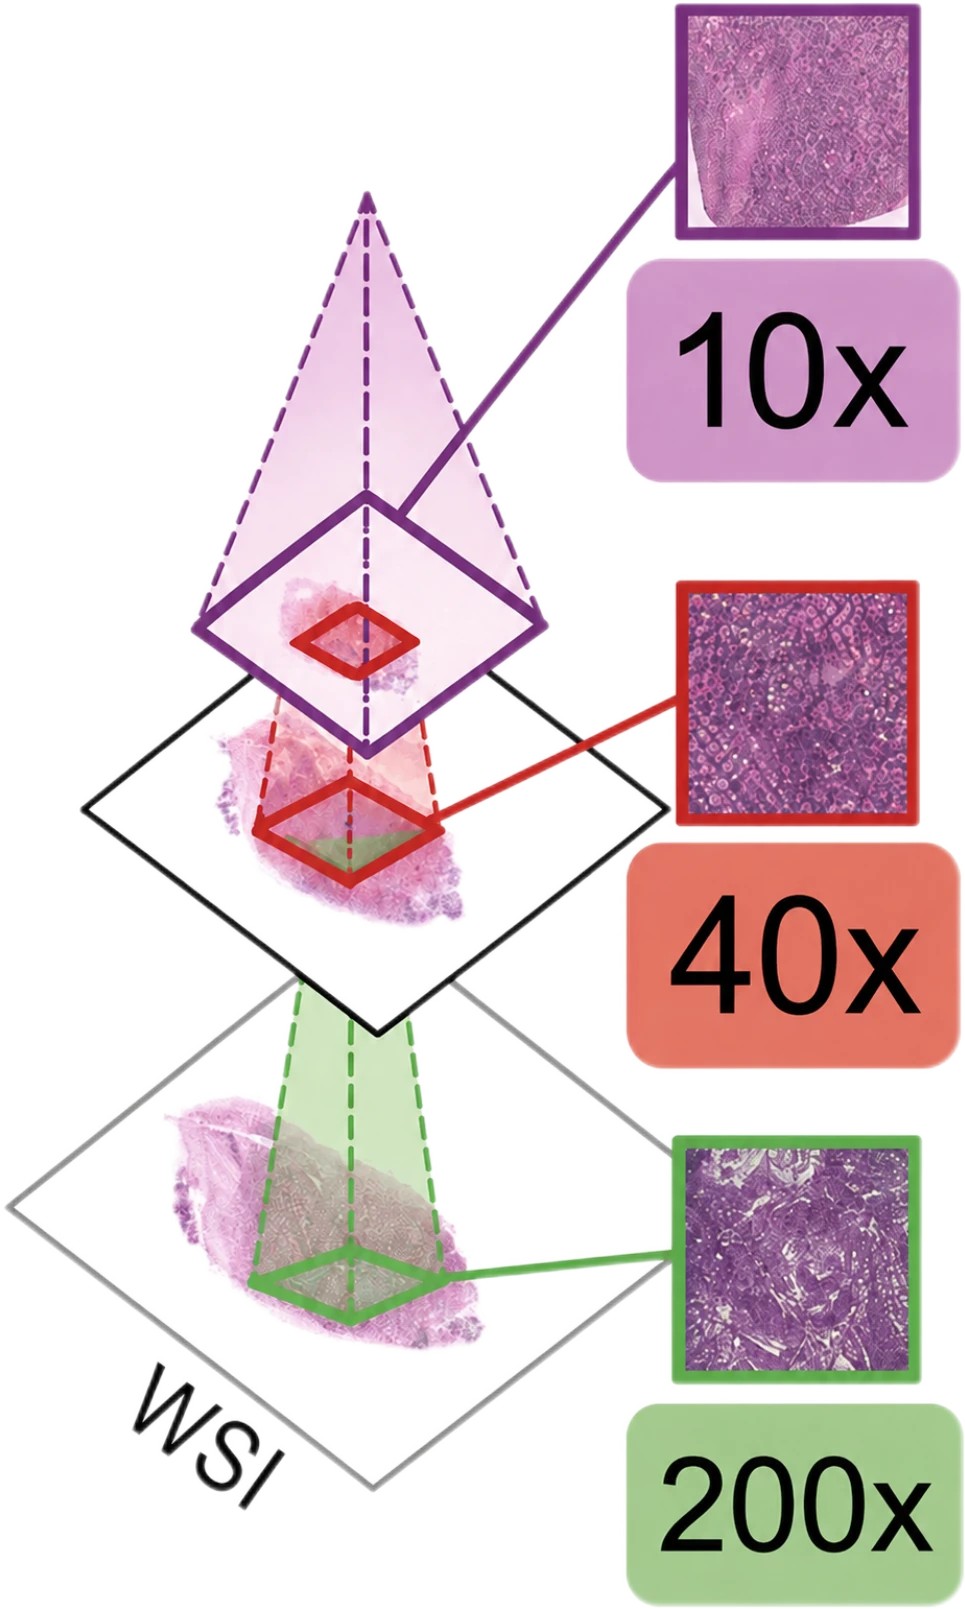
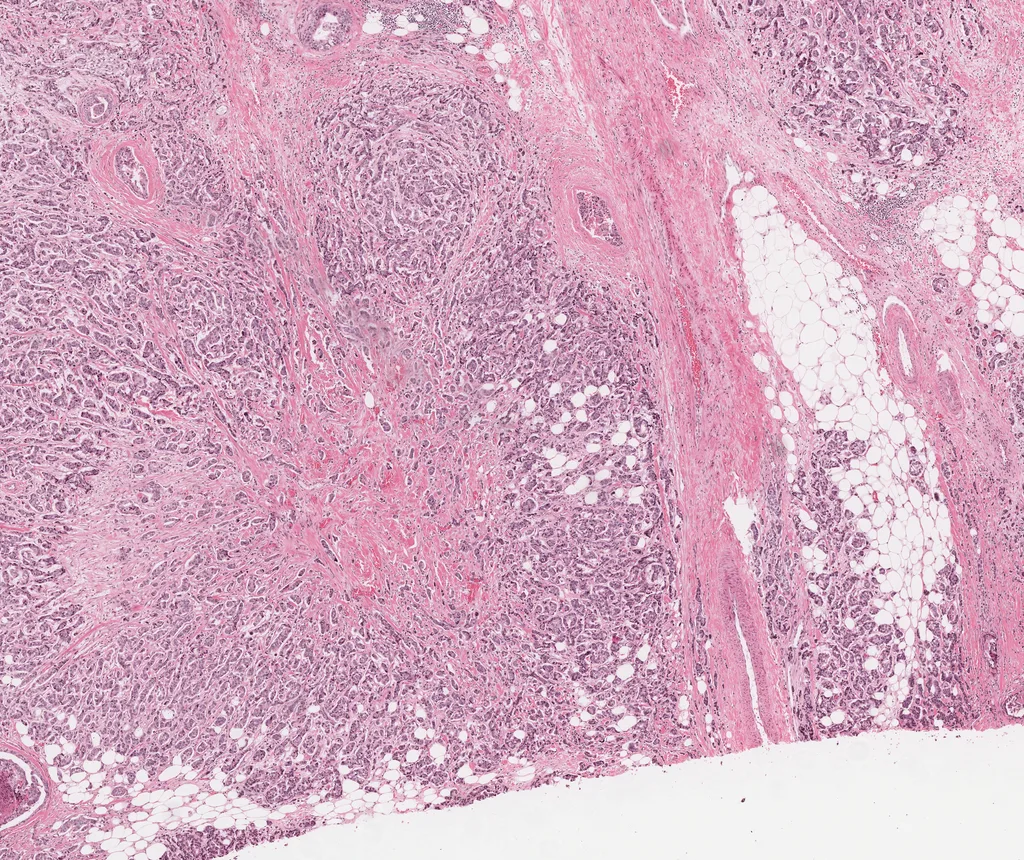
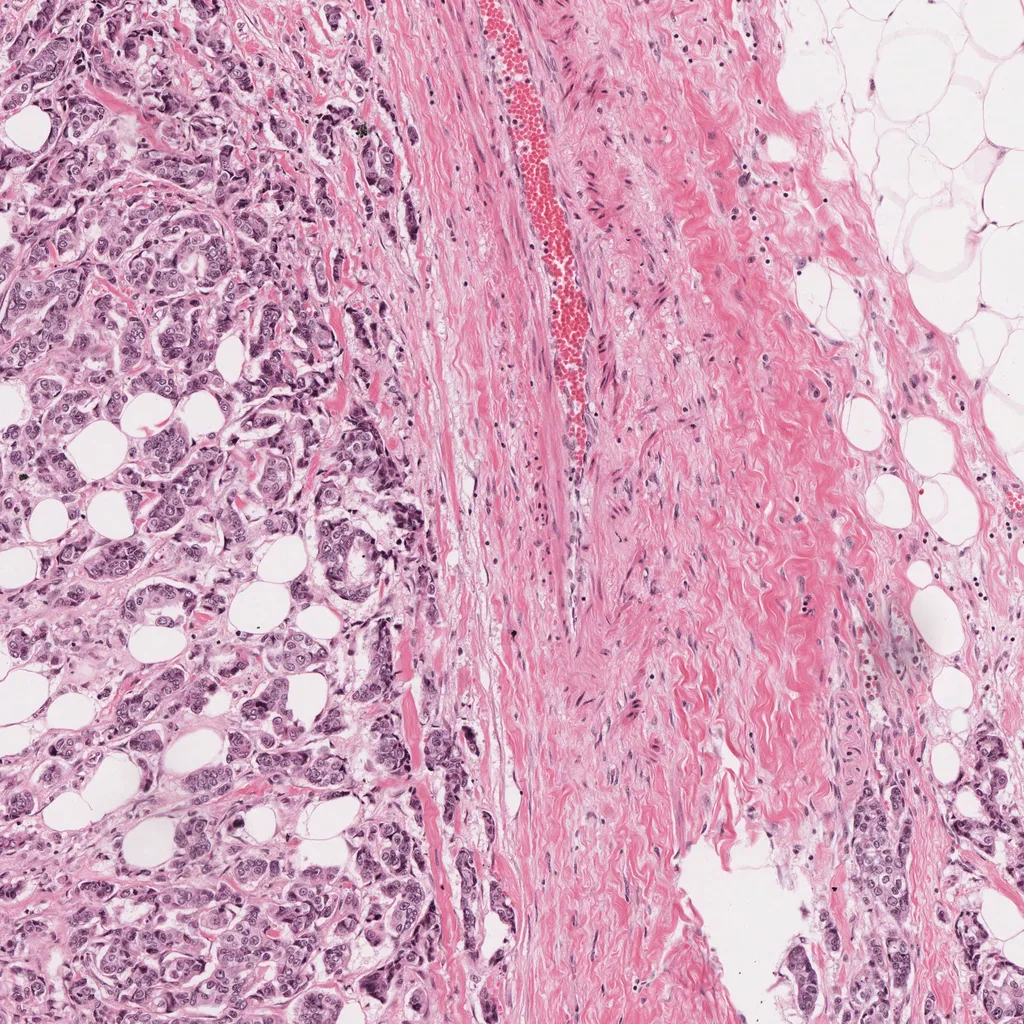
One example at each of three scales — 10× / 40× / 200×.

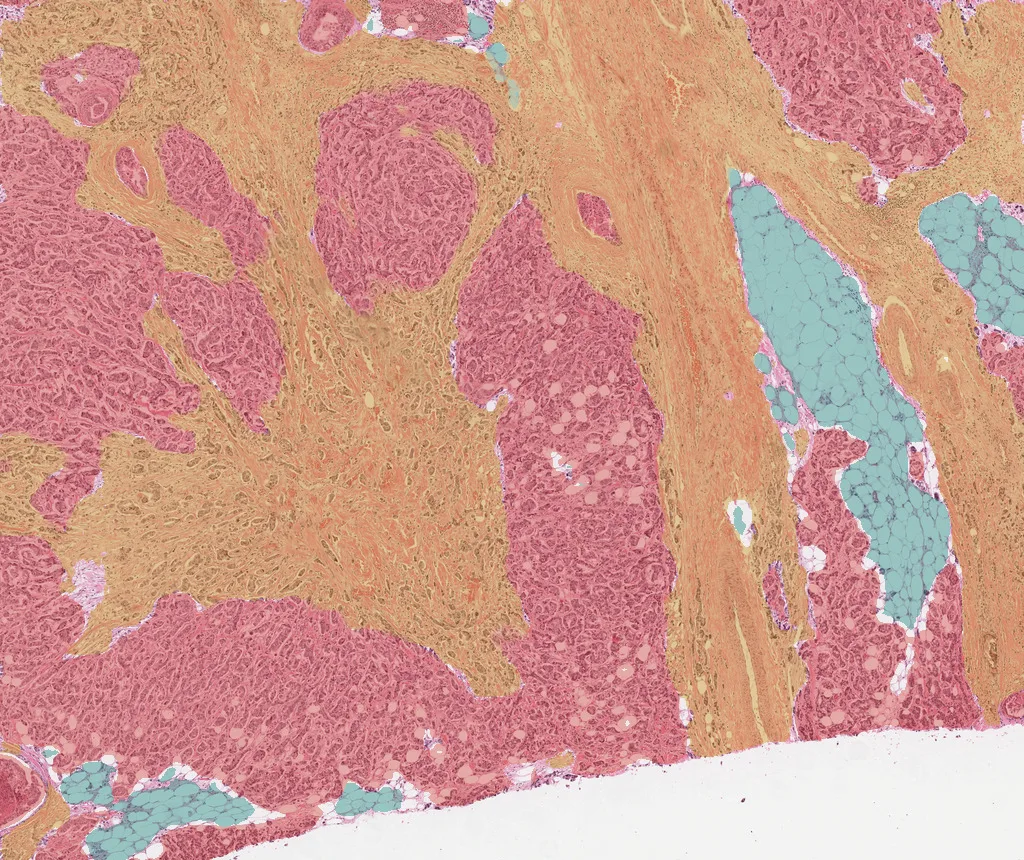
Selected report items map to localizable, inspectable mask regions.
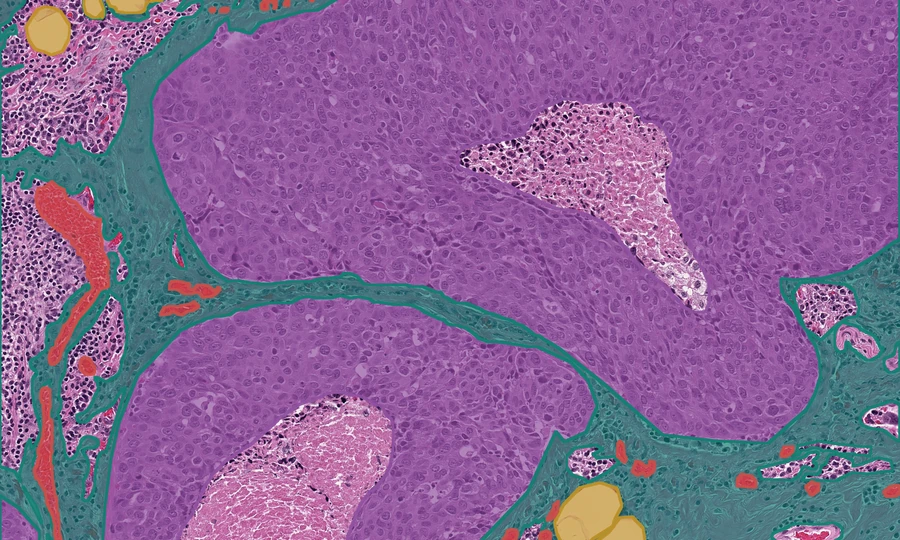
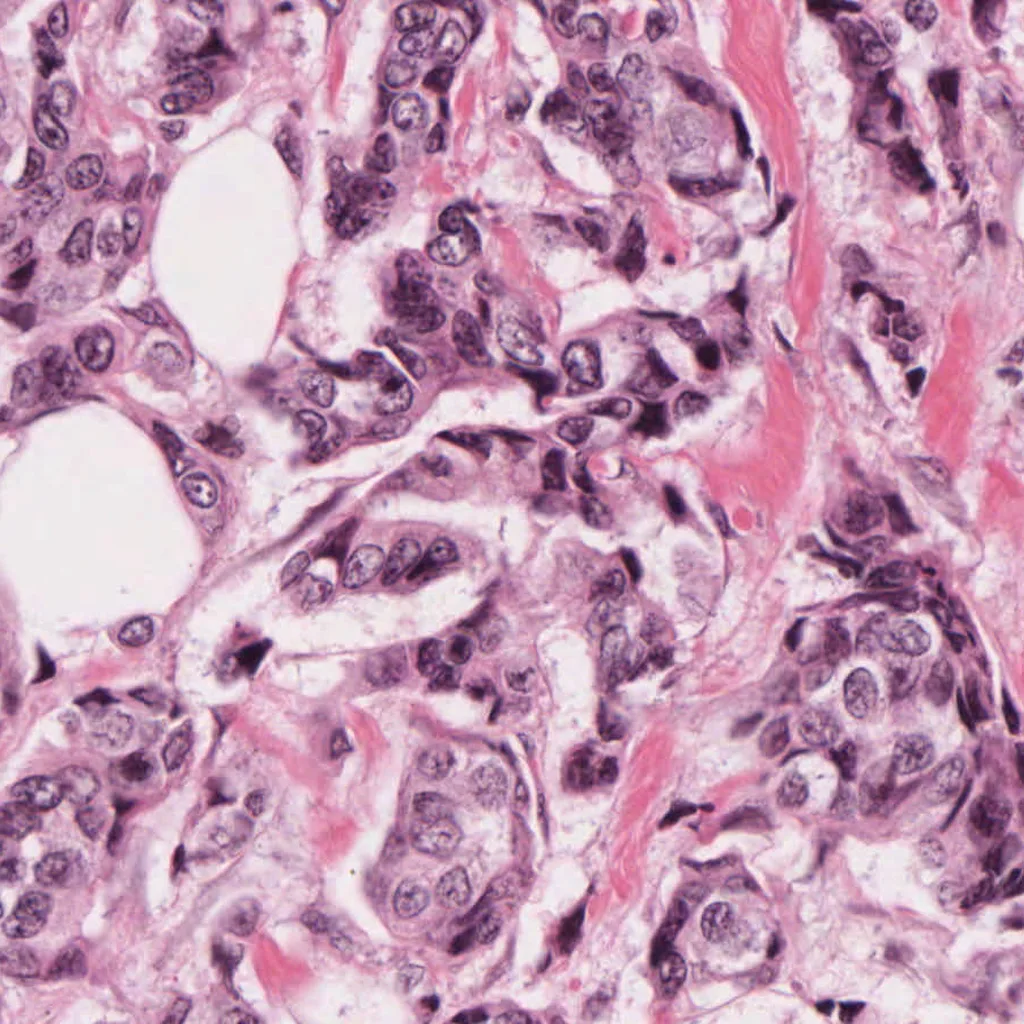
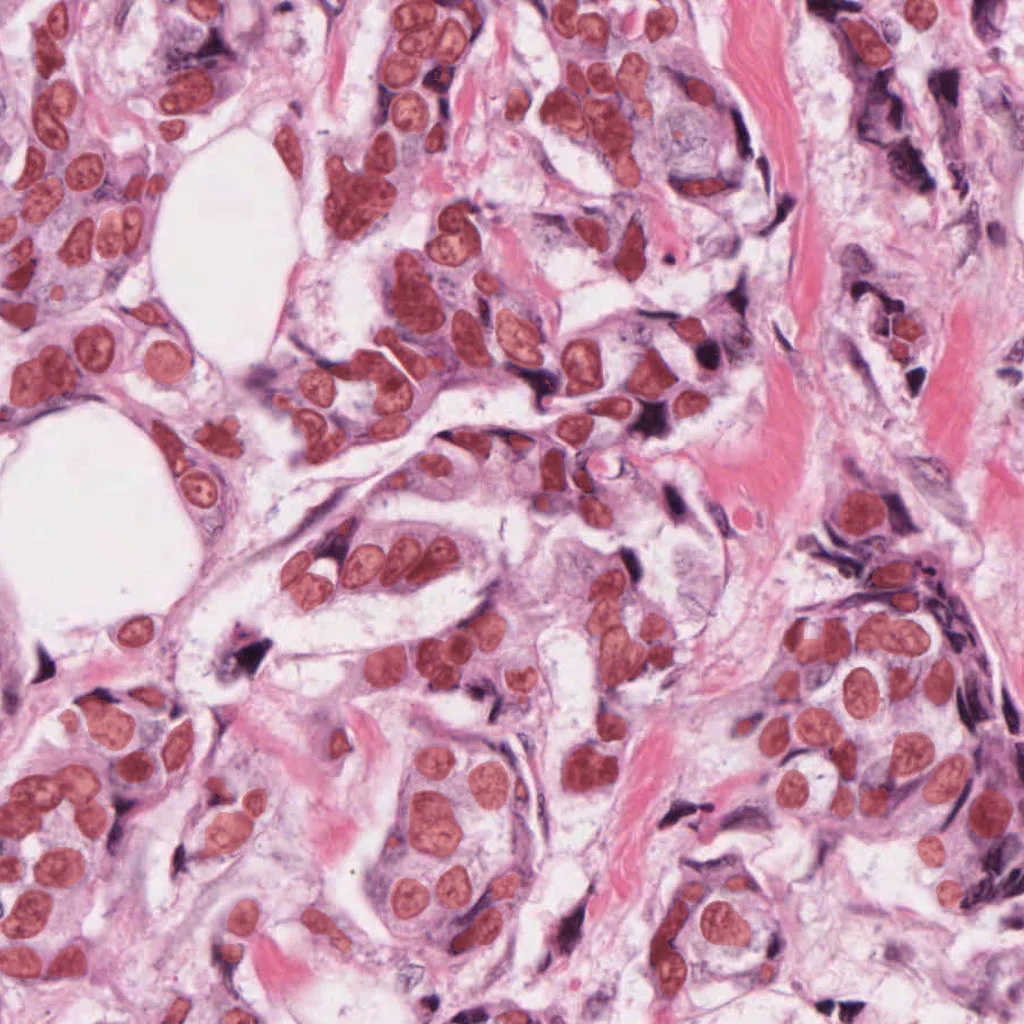
Left is the raw field, center is the structured description from Triplet-V1, right is the mask Triplet-SAM grounds from it. The three rows are three magnifications of the same ROI, and the highlighted entry in the center column is what each mask was grounded on.


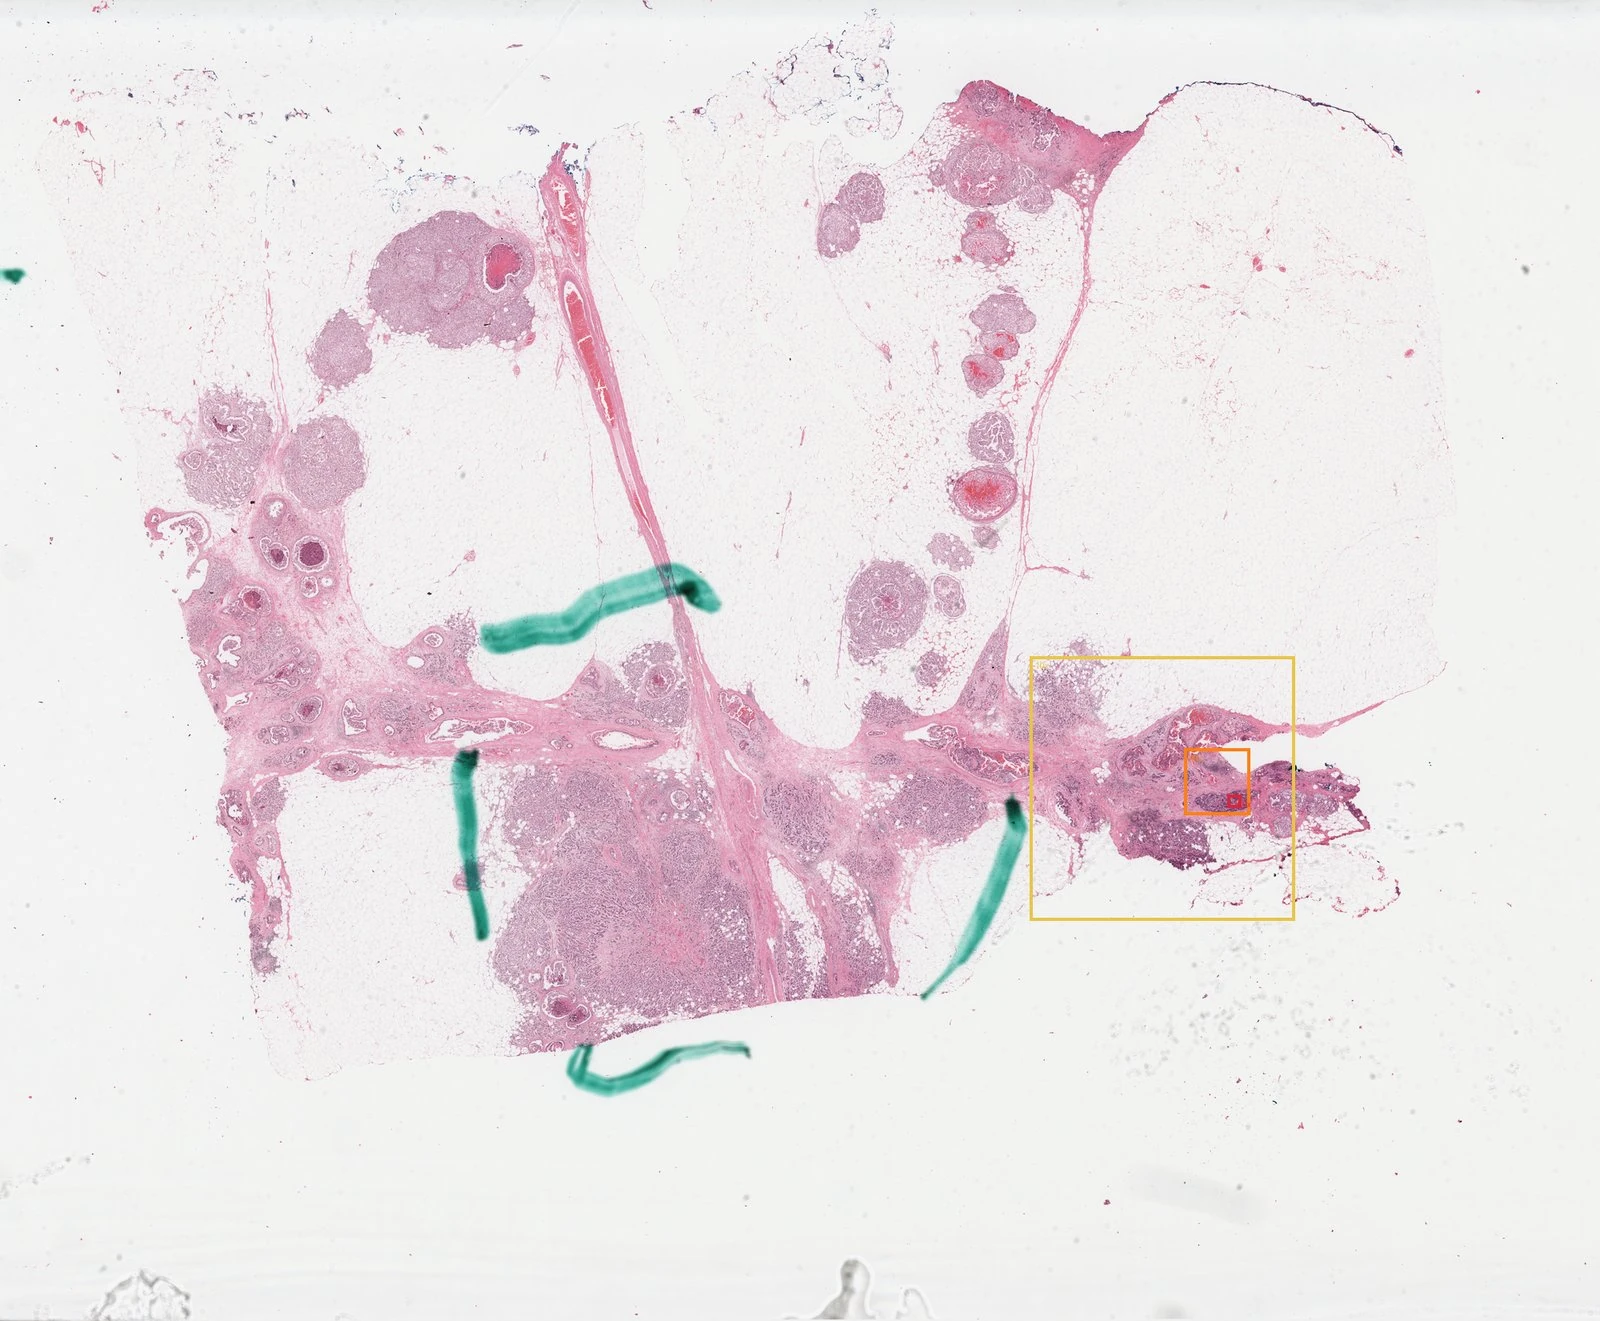
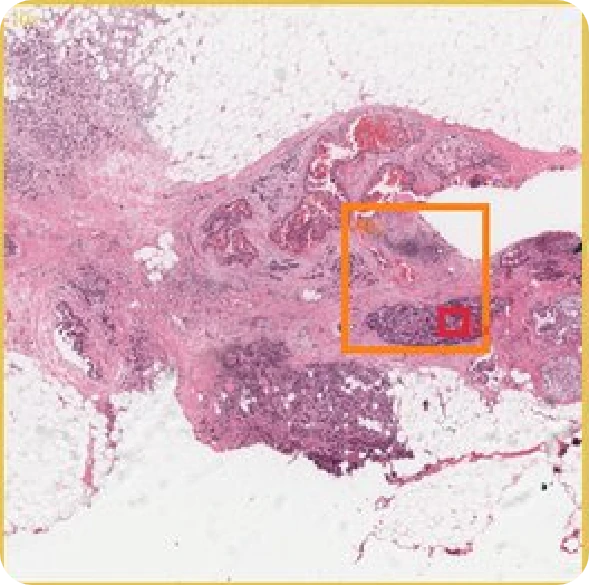
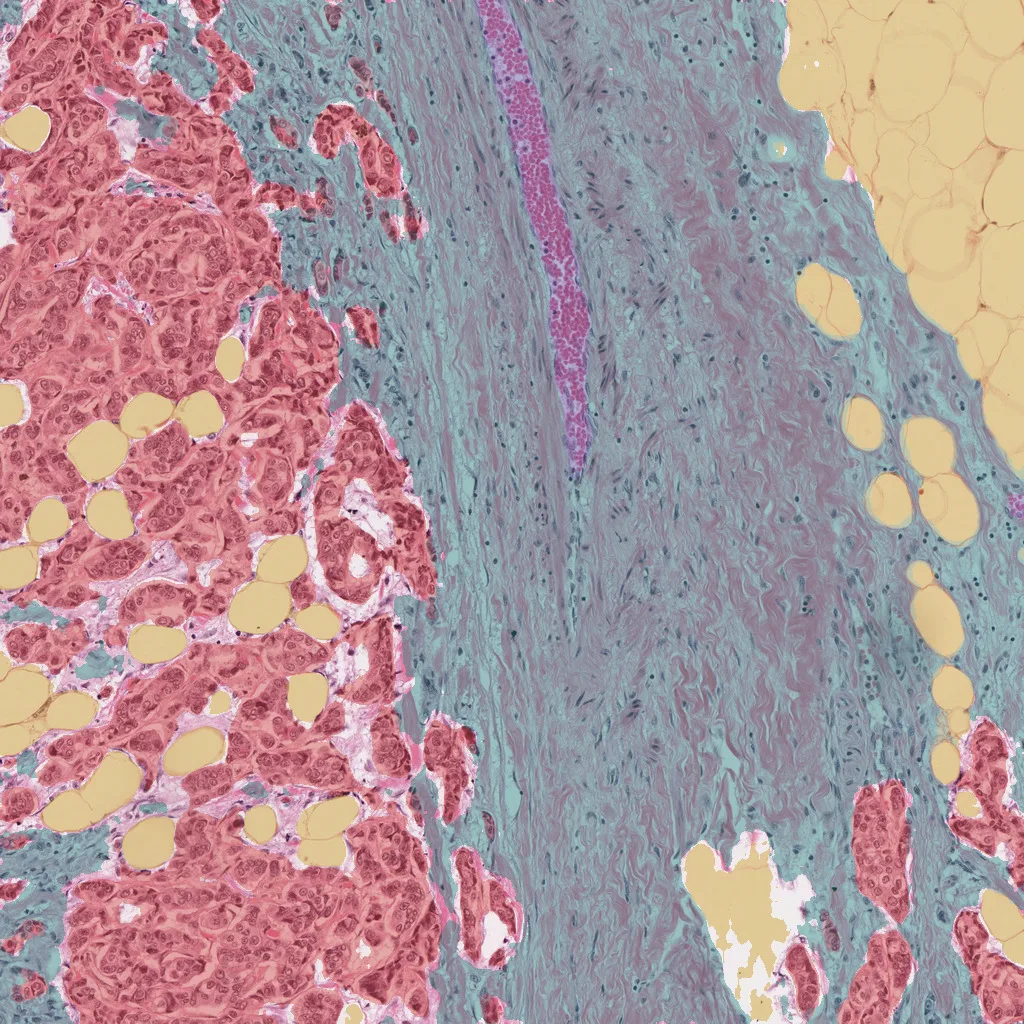
One breast core-biopsy WSI, narrowed from the whole slide to the ROI shared by the three scales below.


Integrate the framework, adapt a model, or deploy WSI inference in your environment. We support research teams and pathology organizations from technical evaluation through production deployment.